Across the world, in millions of software applications, every API request has its own story from when it enters a system until it exits. Today we are going to look at what is tracing and how tracing helps to identify the bottlenecks in the journey of an API request.
In this blog post we will see how Jaeger tracing can be easily added to a gRPC application in Go inside a distributed microservices architecture. Our gRPC protobuf bindings are generated using a tool named gunk - a Go wrapper around gRPC.
What is tracing?
Tracing is the process of adding metadata to a request as it walks different parts of the code/application. Tracing is highly important to highlight the duration of end-to-end request, bottlenecks for individual calls in distributed architecture
Metadata is collected using observability frameworks like Opentelemetry, which then can be analyzed by the developers to understand what is happening throughout the request lifecycle.
While tracing can be added to any application, distributed tracing specifically targets applications that are using microservice architectures where communication between services is much harder to reason about.
Before we deep dive into tracing setup, let’s glance at the two opposing application architectures.
Monolithic architecture
Let’s just go back a few years and think about “monolithic” applications, and imagine the sample request as listed below. There is a request coming in but all the dependent services are available within the same roof, so it flows through the different services before it returns the response.

When some errors/problems were identified for an API request the most common way to debug is to walk through the application logs.
Similarly for identifying bottlenecks, the request received was processed in the same system. So if you want to know the time duration of a request, you would again scan through the log timestamps.
A lot of companies have moved away from this kind of architecture, usually by breaking existing monolithic applications into their silos ie. microservices were born.
Microservices architecture
The name “microservices” itself describes how slim a service shall be. Normally this means it would contain a single feature of an application or groups similar functionality into a single service.
Although microservice architectures comes with an advantage compared to monolithic architectures, there are details to focus on to eliminate the complications.
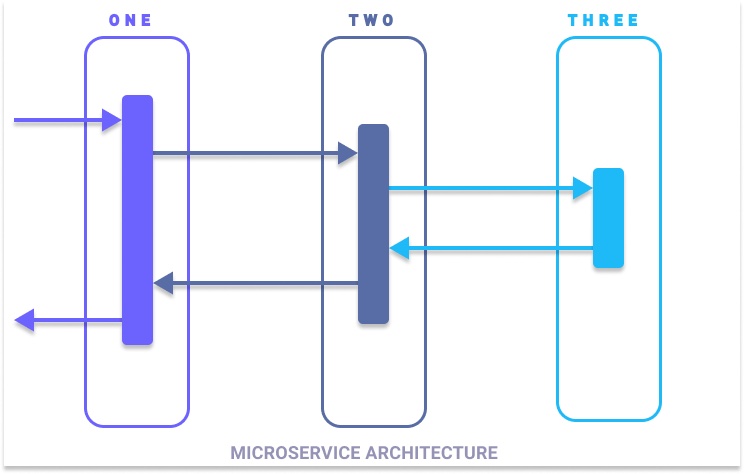
With the above diagram, you can see that the request received at service ONE spans across multiple services before it returns the response. Here the request has been traveling to multiple microservices.
It’s very important to properly decompose the functionality into its silos or services, otherwise, the purpose of microservices is lost as there will be a lot of interservice communications and it’s an unnecessary overhead.
Having said that, a microservice architecture is good for several reasons.
- Scale your development team - Each microservice is owned by a separate team, so there is parallel software development.
- Independent deployment - Each microservice has its own CI/CD process, it shall be independently deployed without touching the other services.
- Less Risk - You are only changing the part of the entire application, and less risk even if you want to roll back when something goes wrong
- Horizontal scaling - Based on the usage of the microservice, you shall be able to scale only a particular service to mitigate the load of the system.
Though there are several advantages, there are complicated things with microservices such as.
- Monitoring - You have to monitor several microservices and it will be a lot of work if the number grows over time
- Automation - Lots of automation has to happen to keep the system running, such as monitoring, perform ci/cd, etc
- Configuration Management - Centralized configuration management is required to change in one place that gets propagated to all microservices
- Interservice communications - The communication between the services shall be async (through messaging) or GRPC based interservice communications
To identify issues during the entire request lifecycle, we are going to go into detail on tracing and telling the story of the API request through a microservice architecture using Jaeger.
Jaeger Tracing
Monitoring the application is not just to ensure the uptime of the application, it’s much more than that. Tracing becomes an integral part of monitoring where it knows exactly the details of the entire request to identify the possible issues such as performance bottlenecks, distributed transactions, and latency optimizations for any type of operations such as HTTP, RPC, or database invocations.
Jaeger is a tool that was developed by Uber for tracing the API requests which was later open-sourced.
Terminology
Span - represents a logical unit of work in Jaeger that has a name, and additional information such as the start of the operation (RPC/DB/method) and its duration.
A span can be nested within another span.
Trace - is the path where the request was traveled across multiple microservices, consisting of multiple spans.

Trace - is the path where the request was traveled across multiple microservices, consisting of multiple spans.
Jaeger Components
Several components comprise the Jaeger service.

Image Courtesy: jaegertracing.io
- Agent is a listener that listens for traces and spans via UDP, then posts it to a collector.
- Collector collects the spans and traces posted by agent, then validate the traces and spans, then store it in a storage backend such as elasticsearch, cassandra, or post to Kafka for centralized storag
- Ingestor is a service that reads from Kafka topic and then sends it to Cassandra or Elasticsearch
- Query is a service that facilitates reading the traces from the backend and return them to the UI to showcase the traces
Integrate gRPC service with Jaeger
To help us get started, I have built an application that reflects the simple microservice architecture shown above - it has services imaginatively named ONE, TWO, and THREE. All three services share the same code, but we’ll deploy it independently for tracing the service with docker for demonstration.
There is already a protobuf, HTTP gateway, and gRPC service files generated using a tool called gunk, if you never know what gunk is, it is a modern frontend and syntax to generate protobuf files.
hello.gunk
// +gunk openapiv2.Swagger{
//         Swagger: "2.0",
//         Info: openapiv2.Info{
//                 Title:       "Hello Service API",
//                 Description: "Simple hello service for demonstrate distributed tracing that shall pass hello message to multiple backend services based on the service identifier",
//                 Version:     "1.0.0",
//         },
//         Schemes: []openapiv2.Scheme{
//                 openapiv2.HTTPS,
//         },
// }
package hello

import (
	"github.com/gunk/opt/http"
	"github.com/gunk/opt/openapiv2"
)

// ServiceID is identifier that the message shall be sent to
type ServiceID int

const (
	UNKNOWN_Service ServiceID = iota
	ONE
	TWO
	THREE
)

// HelloRequest contains an hello request message.
type HelloRequest struct {
	// Msg is a message from a client.
	Msg string `pb:"1" json:"msg"`

	// ServiceID is the service that the hello will be sent to
	ServiceID ServiceID `pb:"2" json:"service_id"`
}

// HelloResponse contains an hello response from specific service.
type HelloResponse struct {
	// Msg is a message from a service.
	Msg string `pb:"1" json:"msg"`
}

// Hello
type HelloService interface {
	// SayHello returns the passed message from respective service
	//
	// +gunk http.Match{
	//         Method: "POST",
	//         Path:   "/sayhello",
	//         Body:   "*",
	// }
	// +gunk openapiv2.Operation{
	//         Tags:        []string{"HelloService", "external"},
	//         Description: "Initiates a say hello request",
	//         Summary:     "Send a hello to a service based on service identifier",
	//         Responses: map[string]openapiv2.Response{
	//                 "200": openapiv2.Response{
	//                         Description: "A successful response.",
	//                         Schema: openapiv2.Schema{
	//                                 JSONSchema: openapiv2.JSONSchema{
	//                                         Ref: "#/definitions/apiHelloResponse",
	//                                 },
	//                         },
	//                 },
	//                 "404": openapiv2.Response{
	//                         Description: "Returned when the resource is not found.",
	//                 },
	//         },
	// }
	SayHello(HelloRequest) HelloResponse
}
Jaeger Client
Next, we are going to integrate Jaeger tracing with the Go application. We are going to use https://github.com/jaegertracing/jaeger-client-go (jaeger-client for go) and https://github.com/opentracing/opentracing-go (open tracing API in go)
// initialize tracer that reads from the environment variable
// JAEGER_AGENT_HOST=jaeger
// JAEGER_AGENT_PORT=6831
// config is from github.com/uber/jaeger-client-go/config
cfg, _ := config.FromEnv()

// create tracer from config
tracer, closer, err := cfg.NewTracer(
  config.Metrics(metrics_prom.New()),
)
defer closer.Close()

if err != nil {
  log.Fatalf("failed to initialize tracer: %v", err)
}

// opentracing is from "github.com/opentracing/opentracing-go"
opentracing.SetGlobalTracer(tracer)
To initialize the tracing with the Jaeger client will need to configure the environment variables
- JAEGER_SERVICE_NAME,
- JAEGER_AGENT_NAME, and
- JAEGER_AGENT_PORT
You shall checkout the all environment variable here
gRPC Server Middleware
The gRPC server middleware is responsible for creating a trace when a gRPC request hits the gRPC endpoint, here is how to integrate the tracer with gRPC server middleware interceptor chain.
s := grpc.NewServer(
    grpc.StreamInterceptor(grpc_middleware.ChainStreamServer(
        grpc_opentracing.StreamServerInterceptor(grpc_opentracing.WithTracer(tracer)),
    )),
    grpc.UnaryInterceptor(grpc_middleware.ChainUnaryServer(
        grpc_opentracing.UnaryServerInterceptor(grpc_opentracing.WithTracer(tracer)),
    )),
)
gRPC Client Middleware
The gRPC client middleware is responsible for recording the span along with the request trace when one service calls another service as a child span. It is very helpful to see various microservices the request traveled to before the response.
  opts := []grpc.DialOption{
    grpc.WithInsecure(),
    grpc.WithKeepaliveParams(keepalive.ClientParameters{
      Time:                time.Second * 10,
      Timeout:             time.Second * 5,
      PermitWithoutStream: true,
    }),
    grpc.WithStreamInterceptor(grpc_middleware.ChainStreamClient(
      grpc_opentracing.StreamClientInterceptor(grpc_opentracing.WithTracer(tracer)),
    )),
    grpc.WithUnaryInterceptor(grpc_middleware.ChainUnaryClient(
      grpc_opentracing.UnaryClientInterceptor(grpc_opentracing.WithTracer(tracer)),
    )),
  }
Local deployment with Docker:
To demonstrate how all fits together with the help of docker-compose we are going to deploy the local instance of the jager-all-in-one image with the three services ONE, TWO, and THREE, that spans requests across the gRPC services. Here is the docker-compose file.
version: '3.7'
services:
  jaeger:
    image: jaegertracing/all-in-one:latest
    ports:
      - "6831:6831/udp"
      - "16686:16686"
    networks:
      - tracing-with-jaeger
  one:
    build:
      context: .
      dockerfile: Dockerfile
    ports:
      - "9000:9000"
      - "9001:9001"
    environment:
      - JAEGER_AGENT_HOST=jaeger
      - JAEGER_AGENT_PORT=6831
      - JAEGER_SERVICE_NAME=ONE
      - JAEGER_SAMPLER_TYPE=const
      - JAEGER_SAMPLER_PARAM=1
      - JAEGER_RPC_METRICS=true
      - SERVICE_NAME=ONE
      - HTTP_PORT=9000
      - GRPC_PORT=9001
      - NEXT_SERVICE_HOST=two
      - NEXT_SERVICE_PORT=10001
    networks:
     - tracing-with-jaeger
    depends_on:
      - jaeger
      - two

  two:
    build:
      context: .
      dockerfile: Dockerfile
    ports:
      - "10000:10000"
      - "10001:10001"
    environment:
      - JAEGER_AGENT_HOST=jaeger
      - JAEGER_AGENT_PORT=6831
      - JAEGER_SAMPLER_TYPE=const
      - JAEGER_SAMPLER_PARAM=1
      - JAEGER_SERVICE_NAME=TWO
      - JAEGER_RPC_METRICS=true
      - SERVICE_NAME=TWO
      - HTTP_PORT=10000
      - GRPC_PORT=10001
      - NEXT_SERVICE_HOST=three
      - NEXT_SERVICE_PORT=11001
    networks:
     - tracing-with-jaeger
    depends_on:
      - jaeger
      - three

  three:
    build:
      context: .
      dockerfile: Dockerfile
    ports:
      - "11000:11000"
      - "11001:11001"
    environment:
      - JAEGER_AGENT_HOST=jaeger
      - JAEGER_AGENT_PORT=6831
      - JAEGER_SAMPLER_TYPE=const
      - JAEGER_SAMPLER_PARAM=1
      - JAEGER_SERVICE_NAME=THREE
      - JAEGER_RPC_METRICS=true
      - SERVICE_NAME=THREE
      - HTTP_PORT=11000
      - GRPC_PORT=11001
    networks:
     - tracing-with-jaeger
    depends_on:
      - jaeger
networks:
  tracing-with-jaeger:
Let’s get the services up by building the docker image running the commands
docker compose build && docker compose up
wait for it to complete.
For more information, please visit the README.md
Once the services are running locally, you shall verify it by checking the docker logs and get something similar to this:
three_1   | 2021/06/28 02:12:49 Starting service : THREE on :11000
three_1   | 2021/06/28 02:12:49 Loading the tracer from env
two_1     | 2021/06/28 02:12:56 Starting service : TWO on :10000
two_1     | 2021/06/28 02:12:56 Loading the tracer from env
one_1     | 2021/06/28 02:13:03 Starting service : ONE on :9000
one_1     | 2021/06/28 02:13:03 Loading the tracer from env
Additionally, you can visit http://localhost:16686/ to view the Jaeger UI, although it won’t be showing much yet.
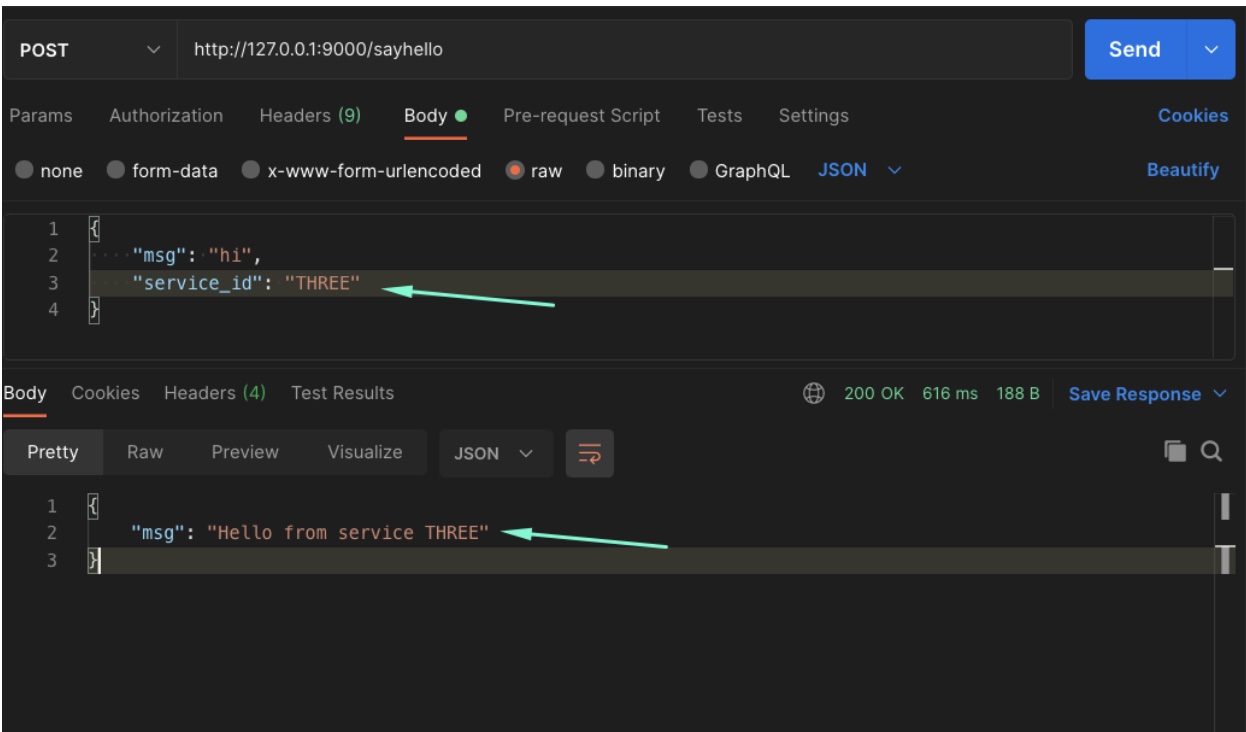
If all looks good, we can run a request through Postman by invoking `sayHello` on service THREE with the below request.
curl --location --request POST 'http://127.0.0.1:9000/sayhello' \
--header 'Content-Type: application/json' \
--data-raw '{
    "msg": "hi",
    "service_id": "THREE"
}'
Expected Response from service THREE:
{
    "msg": "Hello from service THREE"
}
I had injected a sleep statement before invoking the next service, that is before calling from service ONE to service TWO, or from service TWO to service THREE, so you can see the request took 616ms in the image:
Now that all the hard work is done, it’s the most awaited time to see how tracing looks and notice the life of the request.
You can visit http://localhost:16686/ to view the Jaeger UI
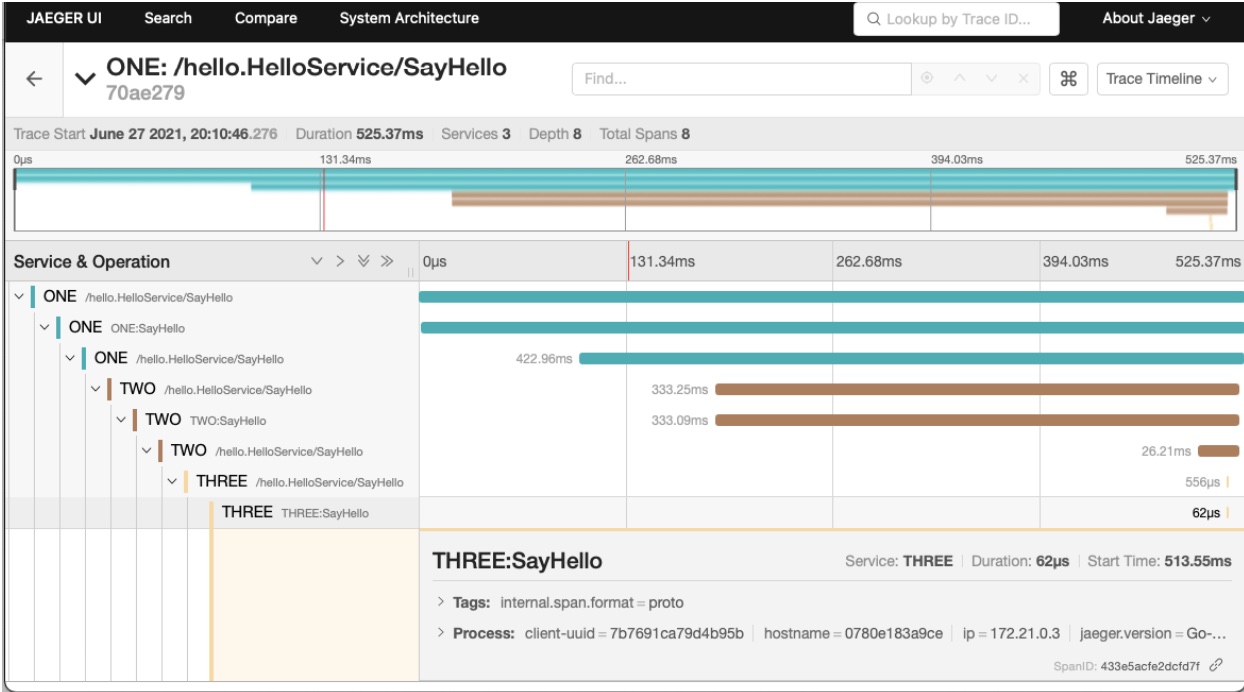
You can see the request traveling through different services and the duration it took throughout the request, and that what we expect to know from distributed tracing and that’s the story of the request.
The full source code is available here in Github.
Conclusion
Jaeger is a CNCF graduated project, and it’s been used widely for Kubernetes-based application deployments. If you would like to run Jaeger in production please check out the reference links.
If your application needs tracing, then I would suggest giving it a try for Jaeger tracing as it is battle-tested with Uber with millions of spans every day.
References
If you want to follow the Jaeger updates via Twitter, then follow https://twitter.com/JaegerTracing